Double Bottom & Top
Background
A double top is two peaks at roughly the same height with a dip in between, like the letter M. The price tries to push above a level twice, fails both times, and that failure suggests the uptrend is tired and may turn down. A double bottom is the mirror image, a W shape, where the price tests a low twice and holds, hinting at a turn back up.
This scanner draws the support and resistance lines for these patterns and finds every double top and bottom on your chart that fits the size limits you set below. For the scriptable version of the same detection, see FindDoublePattern.
Parameters
| Parameter | Description |
|---|---|
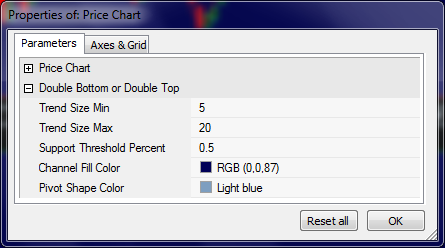
| TrendSize Min, Trend Size Max | The amount in percent a price has to move to be counted as a pivot point. The pattern finder will find all double top and bottom patterns that fit within this size limit. |
| Threshold Percent | Is the maximum percentage distance between the price and the support or resistance line. If the value is small then the support line must have both bottom (or top) pivots touching the line. |
| Channel Fill Color | The fill color between the support and resistance lines. |