Fibonacci
Background
When a market makes a big move and then pulls back, the pullback often stops at one of a handful of well-known levels: 23.6%, 38.2%, 50% and 61.8% of the original move. These are the Fibonacci retracement levels, and many traders watch them as likely places for the price to find support and resume its trend.
This scanner takes recent peaks and troughs, lays the Fibonacci levels over the moves between them, and finds the cases where the price has actually touched one of those levels. For the scriptable version of the same search, see FindFibRetracement.
Parameters
| Parameter | Description |
|---|---|
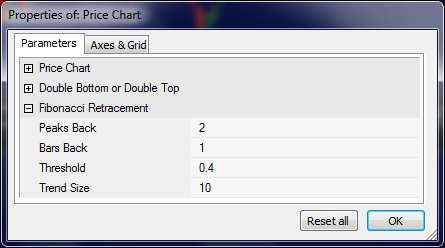
| PeakBack | Fibonacci retracements are calculated on peaks. This value specifies how many peaks to use for the search, starting from the most recent. |
| BarsBack | This value specifies how many price bars to use for checking if the price has touched a Fibonacci level. If this value is 1 then only those Fibonacci retracement patterns with the current price touching a Fibonacci support level will be found. |
| Threshold | Percent value that determines if the price has touched a Fibonacci level. |
| Trendsize | Percent change in price for this point to be considered a peak. |