Trendline
Background
A trendline is a straight line drawn under a run of prices so that it touches several of the lows (or over the highs) along the way. Traders use it as a moving line of support or resistance: while the price keeps bouncing off the line the trend is intact, and a break through it can be a signal something has changed.
This scanner searches your chart for the trendlines that best fit the rules you set below, so you don't have to draw them by hand. For the scriptable version of the same search, see AutoTrendline.
Parameters
| Parameter | Description |
|---|---|
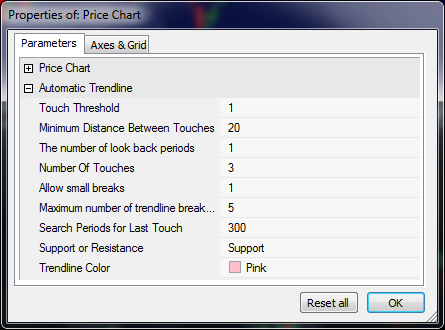
| Touch Threshold | This is a percentage value from the trendline to the price that should be considered a trendline touch. Small values mean the trendline must be very close to the price to be considered touching. |
| Minimum Distance Between Touches | This is the minimum number of bars between trendline touches. |
| The number of look back periods | How far back do you want to find the trendline? If the last trendline touch was found 5 days ago and this value was set to 5 then this trendline will be included in the search results. A value of 1 would only find trendlines that the price has touched today. |
| Number of Touches | The number of touches between the trendline and price for this trendline to be included in the search results. |
| Allow Small Breaks | Allow the price to go below the trendline by a certain percent indicated by threshold. |
| Maximum number of trendline breaks allowed | Specifies how many times the price can go below the trendline and still be considered valid. |
| Search Periods | The number of bars to use to search for a trendline. |