Outputs
The output is what the network learns to predict — a value some number of bars in the future. Choosing it well is half the battle: the network can only be as good as the question you ask it, and a clear, predictable target makes its job far easier than "guess the price". You add it from Add → Output. A network needs at least one output. The New Output dialog has two tabs: Main for the target itself and Advanced for how it is plotted.
The Main tab
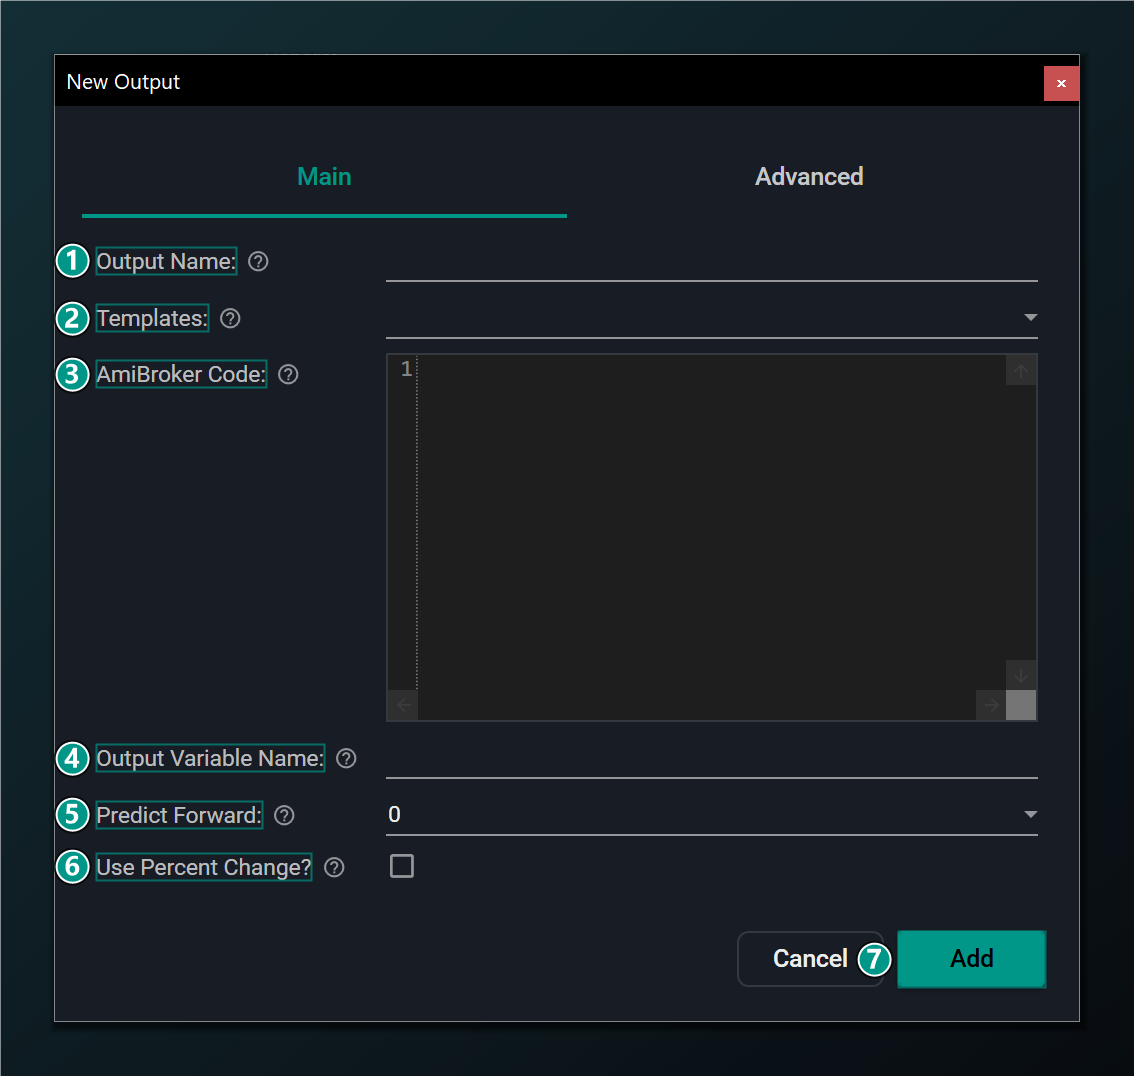
- Output Name — a label for the value the network learns to predict.
- Templates — presets including "Optimal Signal" targets (pivots/zig-zag). Picking one fills name, code, variable and %-change.
- AmiBroker Code — AFL computing the target you want predicted, stored in the variable below.
- Output Variable Name — the AFL variable holding the target value.
- Predict Forward — how many bars ahead to predict. 5 = learn today's inputs to value 5 bars from now.
- Use Percent Change — predict the % change over the horizon instead of the raw value.
- Add — add this output to the network.
Predict Forward: the forecast horizon
This is the single most important choice for an output. Predict Forward is the gap between the bar the network looks at and the bar it's predicting. With it set to 5, training pairs today's inputs with the target value five bars from now — the network learns "given what I see today, here is what happens five bars later". 0 means the current bar; the range is 0–20.
The horizon is a genuine trade-off. A short horizon (1–3 bars) is easier to predict but leaves little room to act and gets eaten by costs; a longer horizon gives a more tradable move but is harder to forecast and noisier. Match it to how you actually trade — a swing trader holding a week of daily bars wants roughly a 5-bar horizon, not a 1-bar one.
The Predict Forward horizon is the single most important choice for an output. It is the gap between the bar the network looks at and the bar it is predicting — a 5-bar forecast learns to map today's inputs to the value five bars from now.
What kind of target? Regression vs. optimal-signal
There are two broad ways to frame the target, and they ask the network very different questions:
- Regression — predict an actual number, such as the price or the percent return some bars ahead. This is the natural choice when you want a forecast line on the chart. It's also the harder question, because the network must nail a specific value out of a noisy future.
- Optimal-signal (classification-style) — predict a simpler, cleaner label instead, like "is this near a swing low worth buying?". The built-in Optimal Signal templates build exactly this kind of target from pivots or a zig-zag. Because the answer is tidier, the network often learns it more reliably than a raw price.
The "Optimal Signal" templates (pivots / zig-zag) build a target that marks ideal turning points. They are a convenient starting point for training a network to anticipate swings, but remember such targets look ahead, so the network's job is to predict them from inputs that do not.
A target that peeks into the future is fine; an input that does is a disaster. Optimal-signal targets are built by looking ahead (that's the whole point — they mark the ideal answer), but make sure none of your inputs secretly do the same. An input that already "knows" the future produces a network that looks perfect in training and is worthless live. This trap — lookahead bias — is the most common way a promising network turns out to be an illusion.
Use Percent Change (outputs)
Just as with inputs, predicting a percent change over the horizon is usually wiser than predicting a raw price level, for the same stationarity reason: a return means the same thing at any price and on any symbol, so it generalises. When this is on, the generated indicator takes the network's predicted percent move and adds it back onto current price to plot an actual level, so you still get a forecast line you can read.
The Advanced tab
The Advanced tab controls how this prediction is drawn on the chart in the generated indicator.
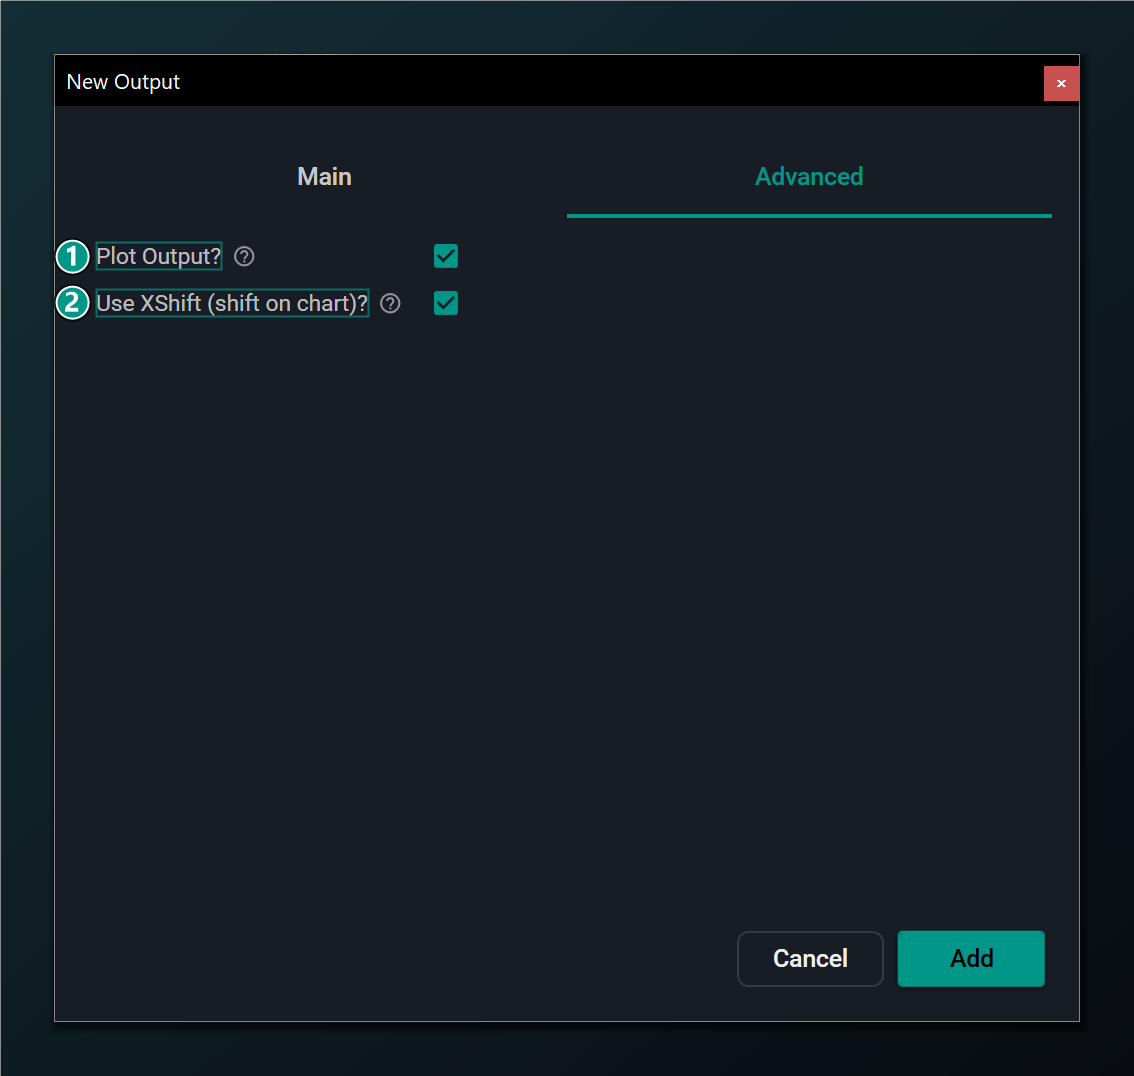
- Plot Output — plot this prediction on the chart in the generated indicator. Default on.
- Use XShift — shift the plotted line forward by Predict Forward bars so a 5-bar forecast lines up with the bar it predicts.
Why XShift matters
A prediction is about a future bar, but it's computed on today's bar — so where should the line sit? Without XShift, a 5-bar-ahead forecast is drawn on today's bar, and you have to mentally slide it forward to compare it with what actually happens. Use XShift does that slide for you: it shifts the plotted line forward by Predict Forward bars so the forecast sits directly above the bar it's predicting, making it honest to read at a glance. Leave it on (the default) unless you have a reason to align differently.
Editing an output
Reopen an output from the tree to adjust its name, variable, horizon or percent-change setting. The Edit dialog mirrors the Add dialog with an Update button.
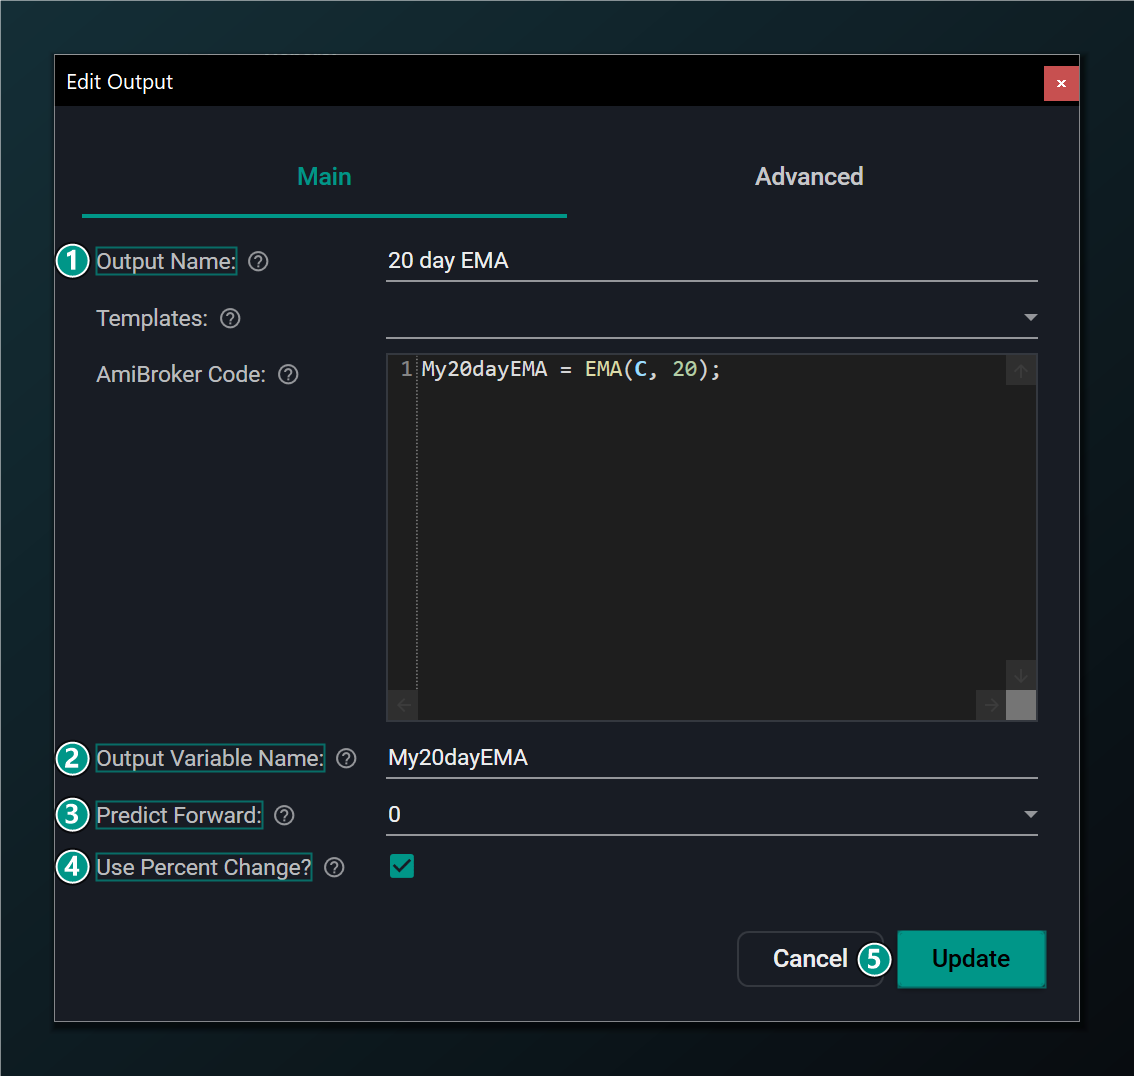
- Output Name — rename the prediction target.
- Output Variable Name — the AFL variable holding the target value.
- Predict Forward — how many bars ahead to predict.
- Use Percent Change — predict the % change over the horizon instead of the raw value.
- Update — save the changes to this output.