Triangle
Background
A triangle forms when the price swings get smaller and smaller, so a falling line drawn over the highs and a rising line drawn under the lows squeeze together toward a point. It usually means the market is winding up, with buyers and sellers in balance, and traders watch for the price to break out of the triangle as a sign of which side has won.
This scanner finds triangles by fitting a trendline to both the top and the bottom of the price at once. Because of that, its settings are the same as the Trendline scanner, just applied to both edges.
Included formula
The toolbox ships this as a ready-made Triangle Pattern Scanner, so you can use it without writing any code. It runs as an Exploration: in AmiBroker open the Analysis window, pick Triangle Pattern Scanner from the WiseTraderToolbox formulas, choose a watchlist and click Explore to list every symbol currently forming a triangle. Applied to a chart, it draws the two trendlines that make up the triangle. The settings below are that formula's parameters.
Parameters
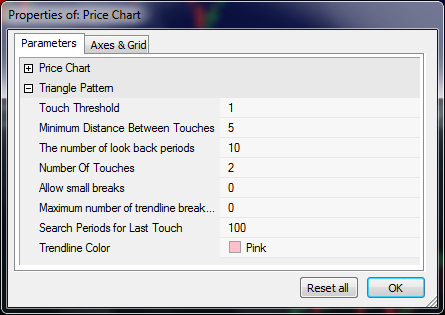
The parameters are the same as that for the trendline scanner except they are used for both the top and bottom parts of the triangle.
| Parameter | Description |
|---|---|
| Touch Threshold | This is a percentage value from the trendline to the price that should be considered a trendline touch. Small values mean the trendline must be very close to the price to be considered touching. |
| Minimum Distance Between Touches | This is the minimum number of bars between trendline touches. |
| The number of look back periods | How far back do you want to find the trendline? If the last trendline touch was found 5 days ago and this value was set to 5 then this trendline will be included in the search results. A value of 1 would only find trendlines that the price has touched today. |
| Number of Touches | The number of touches between the trendline and price for this trendline to be included in the search results. |
| Allow Small Breaks | Allow the price to go below the trendline by a certain percent indicated by threshold. |
| Maximum number of trendline breaks allowed | Specifies how many times the price can go below the trendline and still be considered valid. |
| Search Periods | The number of bars to use to search for a trendline. |